3.1 KiB
| title | sidebar_position |
|---|---|
| Troubleshooting | 90 |
This guide walk you though the steps required to troubleshoot LibreTime.
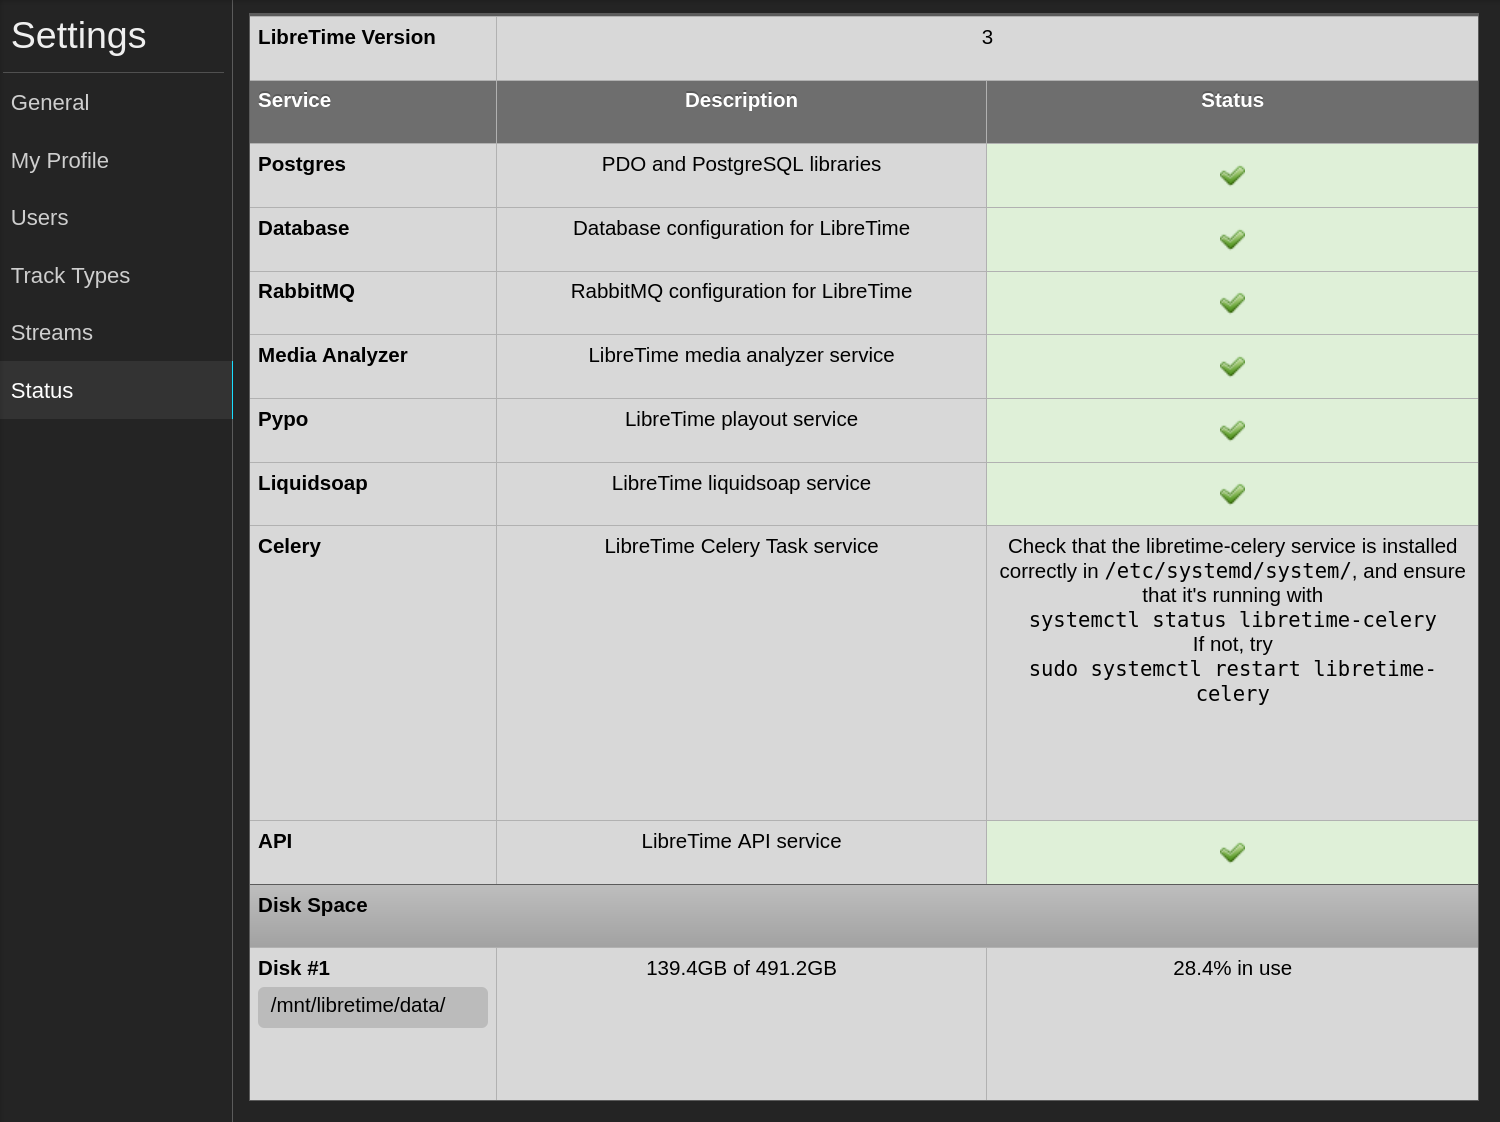
Services status
When facing a problem with LibreTime the first reflex is to verify whether the services are running.
In the web interface, go to Settings > Status to see the state of the services.
Or directly from a terminal:
sudo systemctl --all --plain | egrep 'libretime|nginx|php.*-fpm'
If a service isn't running, you should search for details using the tool running those services. On a common setup, you should use the systemd service status:
sudo systemctl status libretime-worker
:::note
Be sure to replace the service name with the problematic one.
:::
Logs
The next place to search for details on potential errors are the log files.
The /var/log/syslog file contains most of the system logs combined. This log file may contain information that the application logger wasn't able to log, such as early startup errors. You can follow the logs using:
sudo tail -n 100 -f "/var/log/syslog"
# Filter the logs
sudo tail -n 100 -f "/var/log/syslog" | egrep 'libretime|nginx|php.*-fpm'
On a common setup, to access LibreTime specific logs you should search for the following files:
- The
/var/log/libretime/analyzer.logfile contains logs from the analyzer, - The
/var/log/libretime/api.logfile contains logs from the api, - The
/var/log/libretime/legacy.logfile contains logs from the legacy app, - The
/var/log/libretime/liquidsoap.logfile contains logs from liquidsoap, - The
/var/log/libretime/playout.logfile contains logs from playout. - The
/var/log/libretime/worker.logfile contains logs from the worker.
For some LibreTime services, you can set a higher log level using the LIBRETIME_LOG_LEVEL environment variable, or by running the service by hand and using a command line flag:
sudo -u libretime libretime-analyzer --config /etc/libretime/config.yml --log-level debug
The /var/log/nginx/libretime.error.log file contains logs from the web server.
Test the stream inputs
To test or debug your input streams, you can use the tools/test-stream-input.py script to send a test sound to your stream inputs.
To test the main input stream, you can run the following command:
./tools/test-stream-input.py \
    --host radio.example.org \
    --port 8001 \
    --mount main \
    --user source \
    --password hackme

# Or using the --url option
./tools/test-stream-input.py --url source:hackme@radio.example.org:8001/main
If you are hitting HTTP error 401 Unauthorized on the main input stream, make sure that you have configured a user and password in the Settings > Streams settings page.
If you are connected but don't hear anything streaming, make sure that the main input stream is connected and enabled. In addition, to automatically turn on/off the stream on connect/disconnect you can configure the input stream auto switch in the Settings > Streams settings page.