* docs: rework files structure

* rewrite documentation entrypoint

* update category files and use yml

* add manuals entry page

* update admin-manual titles and page order

* create releases sections

* move ssl configuration to reverse proxy

* docs: update website vars and links

* update release note codeblock syntax key

* resurect troubleshooting guide

* Update freeipa custom auth documentation

* add notice about the state of the documentation

* update the backup documentation

* tmp: allow to deploy the website for preview

* Don't use require.resolve for plugins

* Update the main page link dest

* update development environment title

* rewrite the install/upgrade/migrate as guides

* update website docs sections links

* Fix urls

* move release note to documentation

* move home links to vars files

* tmp: update deploy url

* add react to tsconfig to handle jsx linting

* fix: replace absolute url to relative path to files

* tmp: allow CI Website dpeloy on working branch

* Update release note title

* use default syntax highlighting theme

* update the troubleshooting guide

* Wording

* use CodeBlock components

* Better prose

* remove api_client config section

* fix prose errors

* update import prefix for vars file

* reroder docs manuals links

* use sentence capitalization for page titles

* Wording

* missing word

* Update note about syslog log file

* wording
962 B
| title |
|---|
| Listener statistics |
The Listener Stats page on the Analytics menu shows graphs of listener connections to the configured streaming servers for the selected date and time range. On the right side, a green Status indicator shows OK if the connection to the streaming server is active.
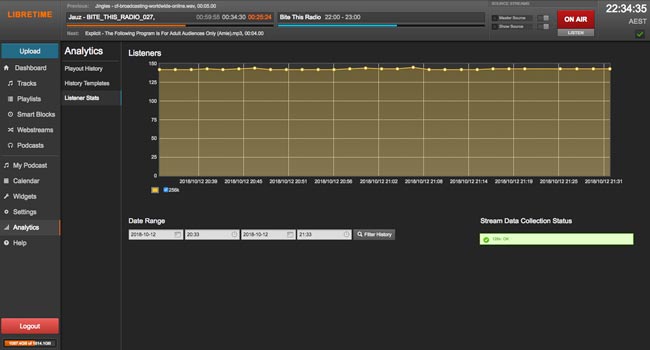
If the status indicator is red, check that the Admin User and Admin Password settings are correct under Additional Options for the named mount point, such as libretime_128, on the Streams page of the Settings menu.
To choose which particular streams should have statistics displayed, click the check boxes for the individual colour-coded mount points, just below the graph.
By default, statistics for the last 24 hours of streaming are shown. To change this date and time range, click the calendar and clock icons in the lower left corner of the page, then click the magnifying glass icon.